New CDFI Fund Data Shows CDFIs Increasing & Expanding Their Impact, Strengthening CDFI Advocacy for 2026
2023 gains occurred at all levels
New data on CDFI lending shows that CDFIs accelerated their impact in 2023, making almost $40 billion of new loans in more places. The new data are the 2023 Transaction Level Reporting (TLR) reports that CDFIs submitted to the CDFI Fund.
The addition of the 2023 TLR data shows a 16% increase in total CDFI financing nationally, up more than $37.8 billion, bringing the total from 2005 to 2023 to $272,320,974,488. In addition, the average per capita lending nationally increased $102, from $711 to $814 per person.
2023 includes the first year of lending data after the $8 billion+ in federal investments into depository CDFIs under the ECIP (Emergency Capital Investment Program) in 2022. ECIP recipients include banks, thrifts, minority-owned depository institutions, and community development credit unions (CDCUs).
CDCUs on the Rise
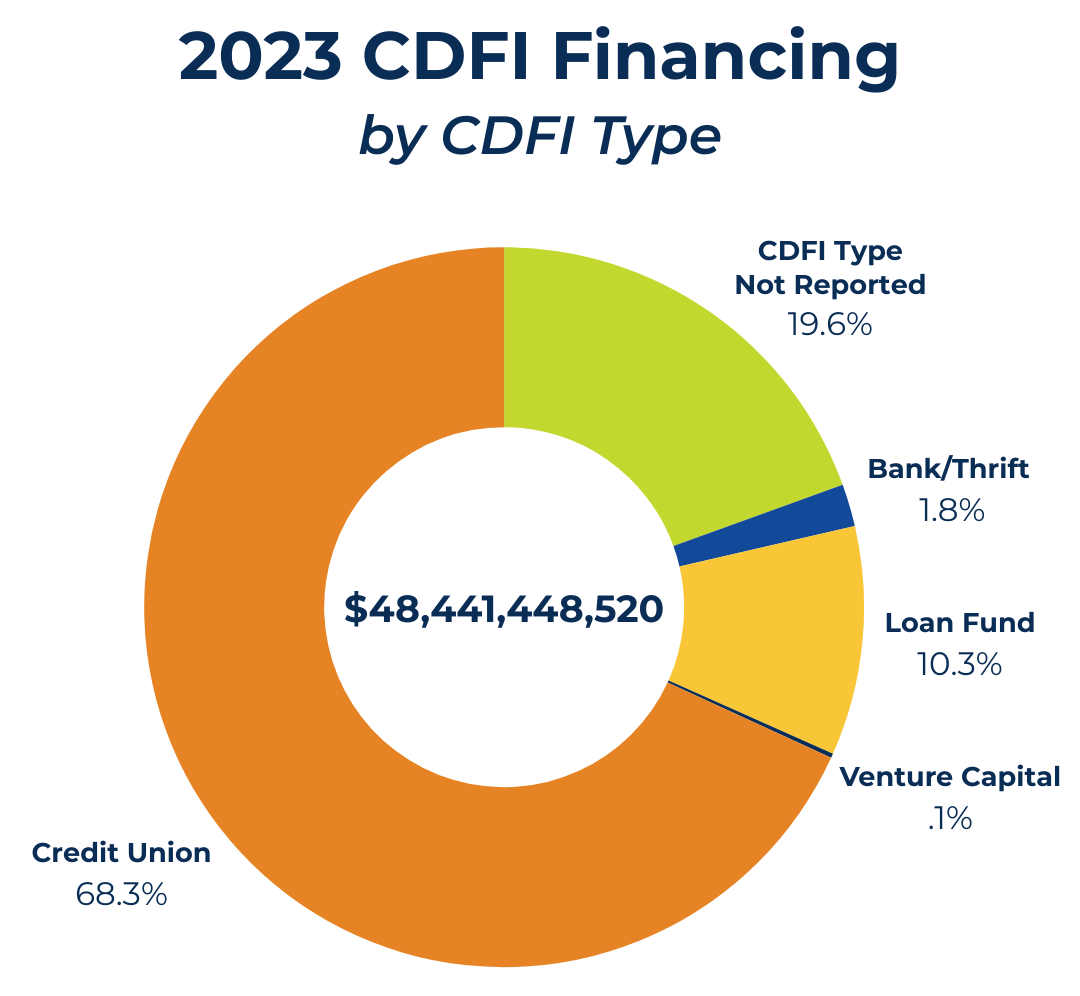
The most significant change in 2023 is the increase in the number of CDCUs reporting to the CDFI Fund and the amount of financing those CDCUs provided.
In 2023, CDCUs loaned $33.1 billion —68% of the annual total for all CDFIs—compared to slightly less than $5 billion reported by loan funds, $860 million by CDFI banks and thrifts, and $9.5 billion by CDFIs that did not report their institutional types.
Inclusiv, the national trade organization for CDCUs, campaigned to certify CDCUs well before the ECIP. Including CDCUs, some of which are large, adds a dimension to CDFI lending that we have been missing for decades.
Policy Implications
The new TLR results strengthen the advocacy case that CDFIs—particularly but not only CDCUs—can make, that they are increasing their impact nationally in most states and congressional districts.
Summary of 2005-2023 CDFI Advocacy Data
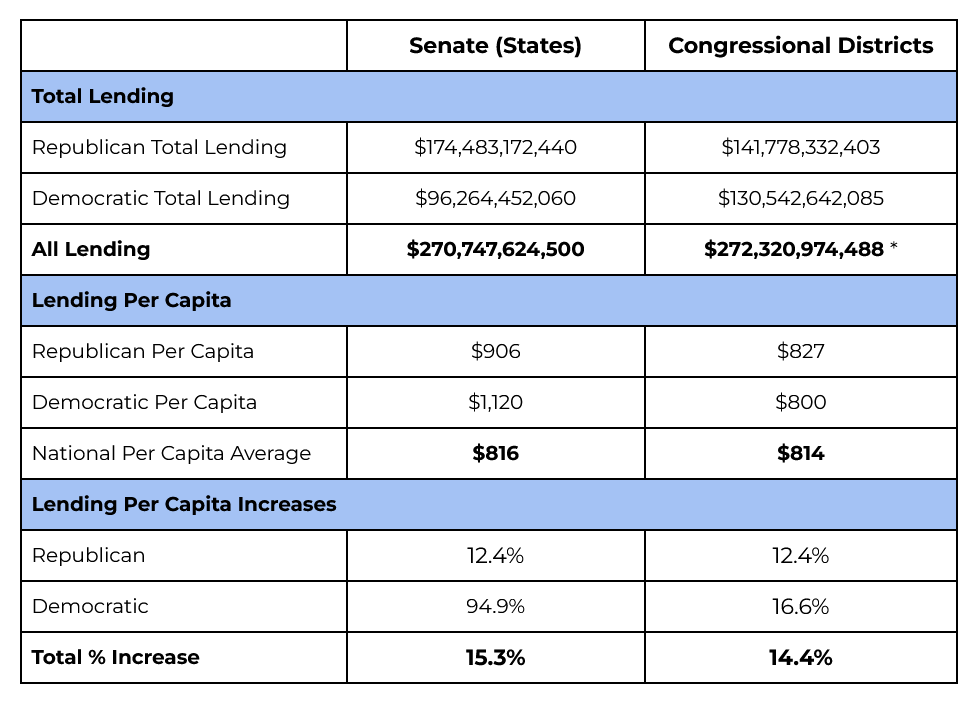
* The totals differ because the congressional district total includes the District of Columbia.
CDFI Friendly America has updated its CDFI Advocacy Map to include the 2023 data. The CDFI Advocacy Map is a free tool that simplifies advocacy by showing CDFI lending by Senate seat (states) and by congressional districts, as well as more detailed views by census tracts. The Map also organizes data by state legislative districts.
CDFIs Continue to Favor Republican-Represented Places
Total lending increased 14% in states represented in the Senate by Republicans and 15% in Republican congressional districts. Republican states continue to receive nearly two-thirds (more than $174 billion) of all CDFI financing from 2005 to 2023, while Republican districts received 52% ($142 billion).
With the 2023 results, per capita lending in Republican-represented states increased from $806 to $906 and from $736 to $827 in Republican congressional districts.
By comparison, total lending in places represented by Democrats increased 20% and 17% in Democratic-represented states and districts, respectively. Per capita lending in Democratic states nearly doubled, from $575 to $1,120, but rose by just 17% in Democratic congressional districts, from $686 to $800.
Recent news from Washington D.C. has confirmed what we already knew: members of Congress on both sides of the aisle recognize the important role CDFIs serve in their districts and states. Despite the support demonstrated over the past year, the future of the CDFI Fund remains in flux under the Trump administration.
Breaking down CDFI lending by congressional districts and states allows us to observe any differences or trends between Republican and Democratic geographies. Below are some of the highlights from the new data set:
States
The state with the highest total CDFI lending since 2005 changed from Mississippi ($27,924,155,784) to California, with $31,433,528,973.
Mississippi remained the state with the highest per capita average of $9,461 (by comparison, California’s was $801, $13 below the national average for 2005-2023).
Wyoming remained the state with both the lowest CDFI lending by dollar amount and per capita average.
Congressional Districts
For 2005-2023, Mississippi’s 3rd Congressional District remained the district with the highest total lending ($9,146,908,024) and the highest per capita of $12,294. That district is represented by Republican Michael Guest and includes part, but not all, of Jackson.
The congressional district with the lowest total lending and the lowest per capita lending over these 19 years was Pennsylvania’s 13th District, represented by Republican John Joyce, with $30,527,182, or just $40 per capita.
Why The Data Matter: Targeted Advocacy
The data show that CDFIs are doing impressive work in every state and congressional district, without regard to politics. Despite several attacks from the Trump Administration in 2025, an overwhelming number of Republican senators and members of Congress support the work of CDFIs expanding economic opportunity in their communities.
The progress is real, but so is the work ahead. CDFIs need support in order to continue helping underserved communities. In recent years, many CDFIs have relied heavily on government funding, but with the CDFI Fund still under threat, it is important to expand advocacy efforts both to government officials and alternate funding sources like banks and foundations.
While CDFI lending has increased steadily since the 1980s, 20% of all congressional districts—87 out of 436—still qualify as CDFI Opportunity Markets, also called CDFI Deserts. At the state level, there was also no change, with 8 states qualifying as CDFI Deserts, all of which voted for Trump in 2024.
CDFI Opportunity Markets are places where more than 50% of the census tracts are economically-distressed Qualified Investment Areas under CDFI Fund rules, and CDFI lending totals less than 80% of the national per capita average.
Note on the data: Tract Advisors, led by Lance Loethen, provided the TLR data to CDFI Friendly America. The new data is already incorporated in the CDFI Advocacy Map and will be incorporated in CDFI Friendly America’s CDFI Market Map in early 2026.